Ask Instead of Building a Report
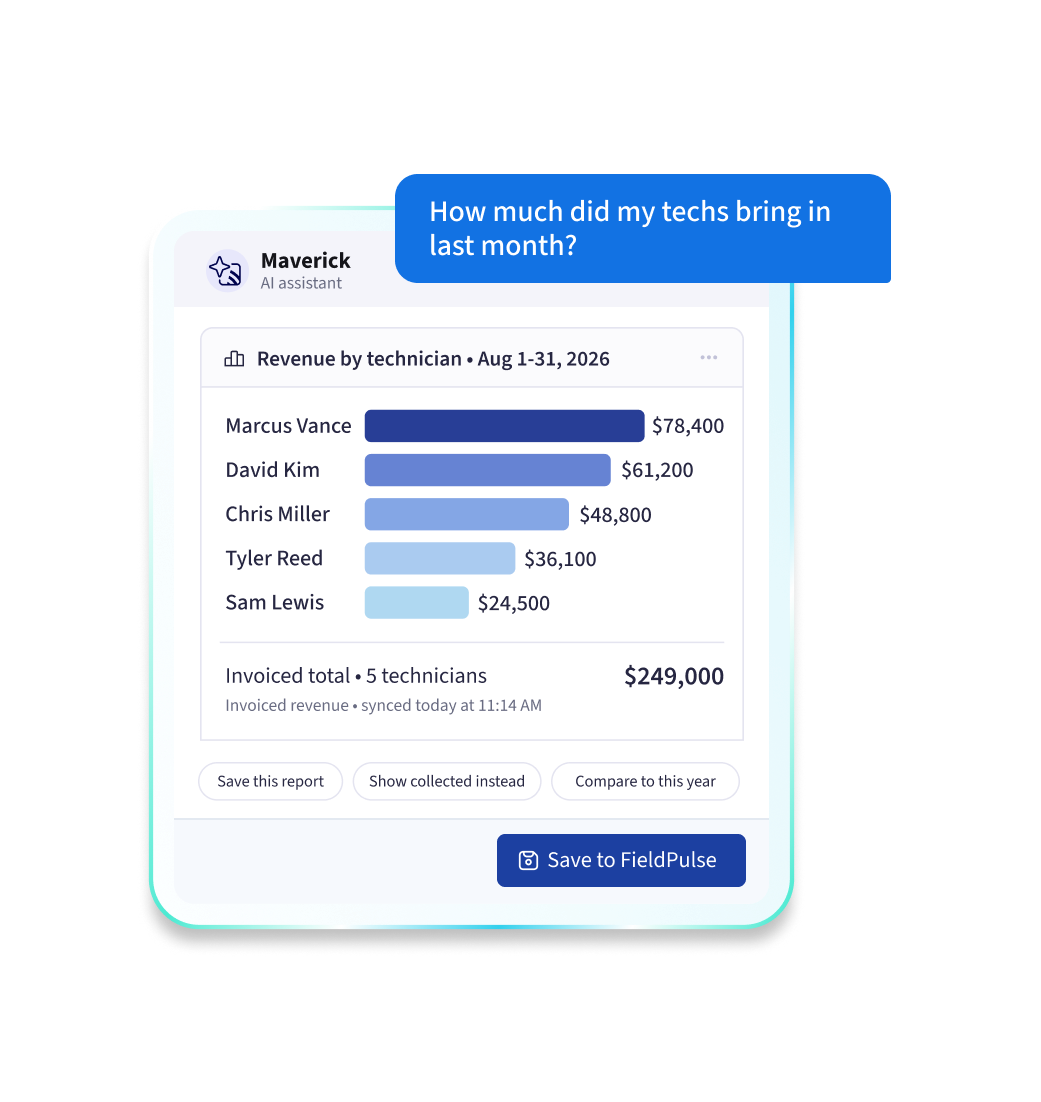
Maverick, FieldPulse’s AI assistant, tells you which tech is generating the most revenue and who’s falling behind. It also answers questions about revenue, unpaid invoices, and jobs. Get the answer in seconds and pin the report it builds to your dashboard.

Know Which Jobs, Techs, and Job Types Are Paying Off
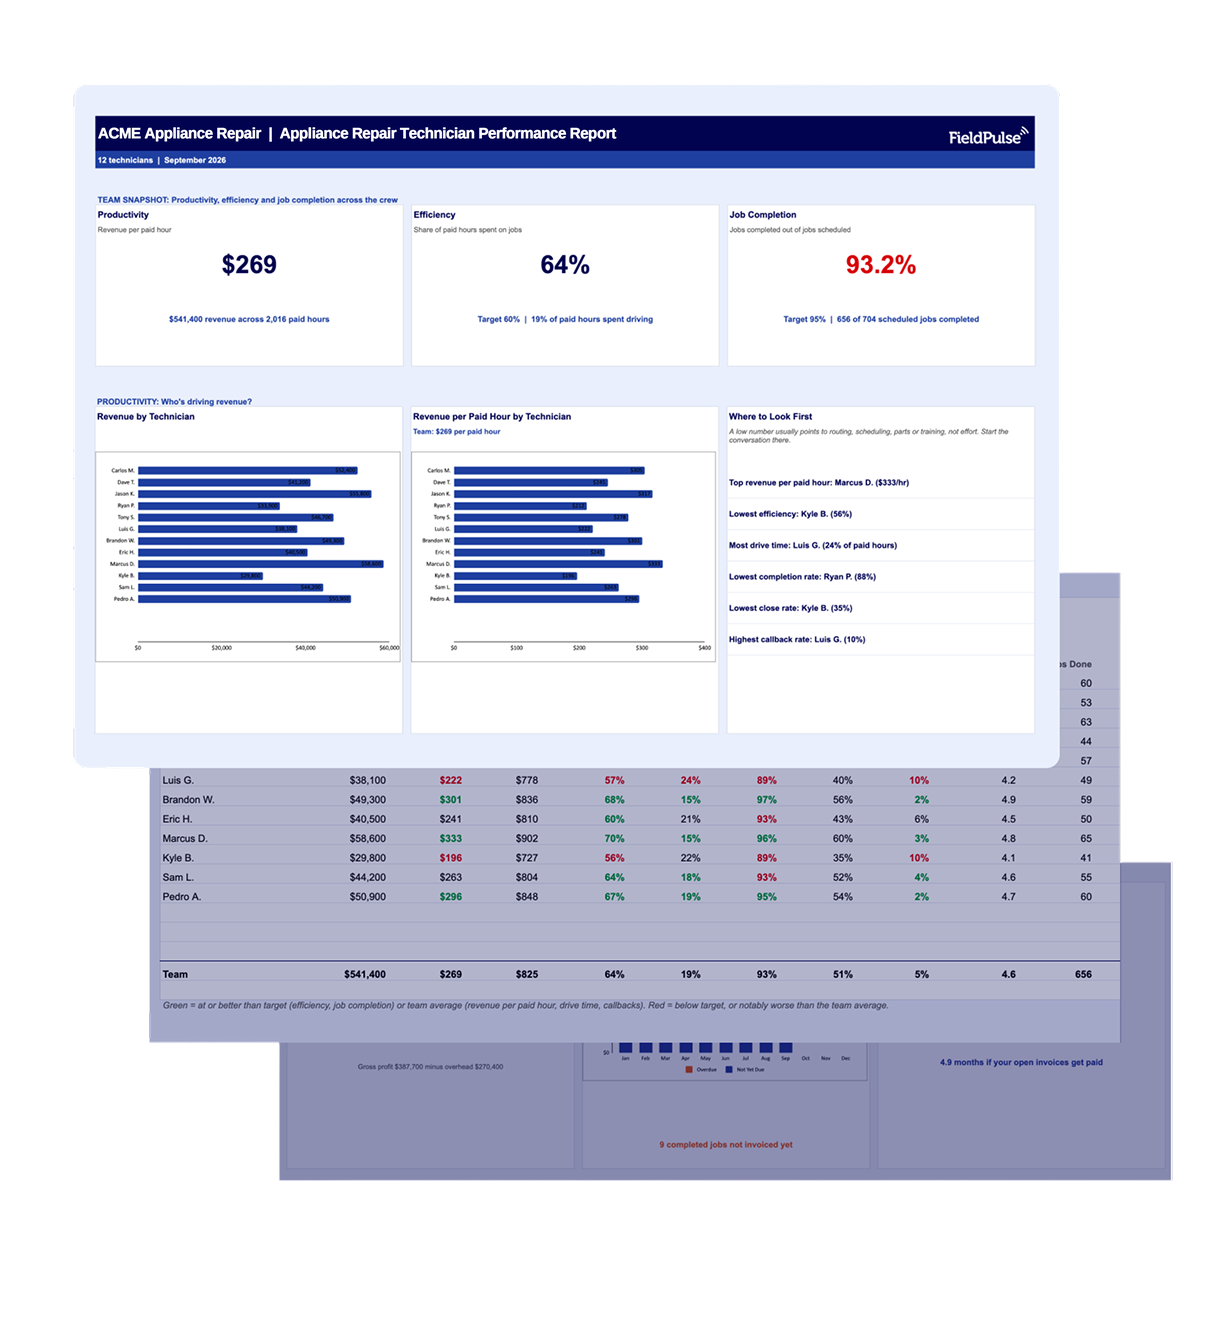
FieldPulse reporting tracks revenue, job profitability, technician productivity, and costs for materials, labor, and overhead. Build custom reports filtered by job type, technician, or location to see where the business is making money and where it isn’t.

Your Key Numbers, Updated in Real Time
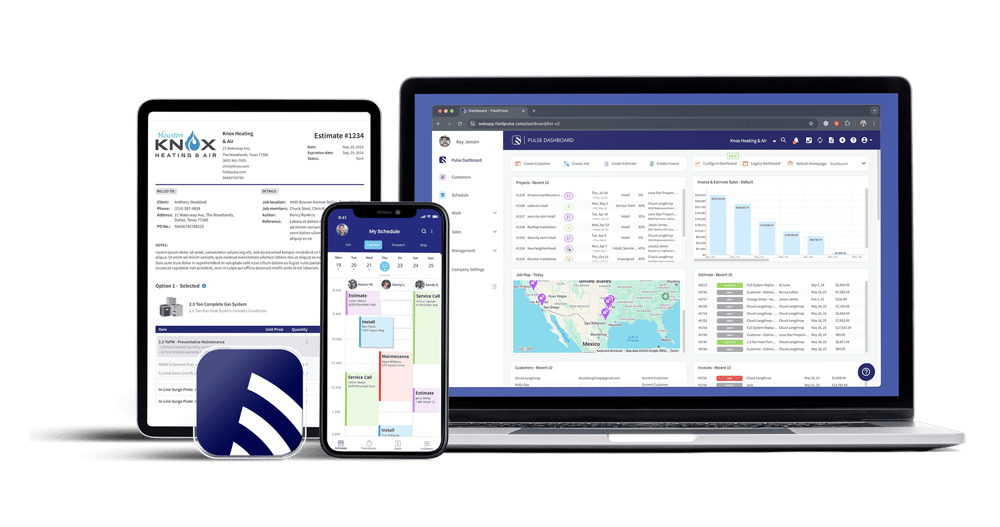
Build your dashboard from the reports that matter most and arrange it the way you want. Track everything from team performance to revenue in real time, so you can check how the business is doing any day.